Features
effmass can:
Read in a bandstructure: It is assumed you have used a DFT calculator to walk through a 1D slice of the Brillouin Zone, capturing the maxima and minima of interest. effmass uses the Python packages [vasppy](https://github.com/bjmorgan/vasppy) for parsing VASP output, and ASE for parsing the Castep output.
Locate extrema: These correspond to the valence band maxima and conduction band minima. Maxima and minima within a certain energy range can also be located.
Calculate curvature, transport and optical effective masses: The curvature (aka inertial) and transport masses are calculated using the derivatives of a fitted polynomial function. The optical effective mass can also be calculated assuming a Kane dispersion.
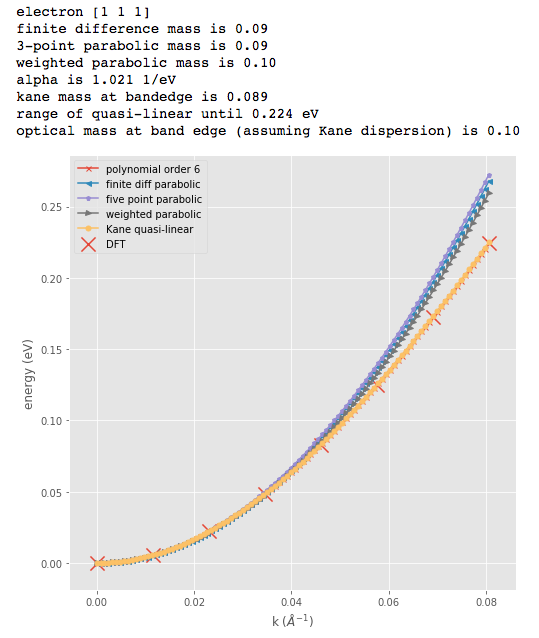
Assess the extent of non-parabolicity: Parameters of the Kane quasi-linear dispersion are calculated to quantify the extent of non-parabolicity over a given energy range.
Calculate the quasi-fermi level for a given carrier concentration: Using density-of-states data and assuming no thermal smearing, effmass can calculate the energy to which states are occupied. This is a useful approximation to the quasi-Fermi level. Note: this is only supported for VASP and requires the output file `DOSCAR`.
Plot fits to the dispersion: Selected bandstructure segments and approximations to the dispersion (assuming a Kane, quadratic, or higher order fit) can be visualised.
The command line interface provides basic functionality for calculating parabolic effective masses. For those who have a basic familiarity with Python there is an API which provides access to more (non-parabolic) effective mass definitions. Depending on the functionality and level of approximation you are looking for, it may be that one of the packages listed [here](https://effmass.readthedocs.io/en/latest/Related%20packages.html) will suit your needs better.